Application behaviors in interms of port/session consumptions on NAT
IPv4 address sharing is an important mechanism during transition phase. Application behaviors in terms of port consumption not only impact the deployment factor (i.e., port range size) for AplusP solution but also play an important role in determining the port quota per customer on AFTR for Dual-Stack Lite.
We tested popular applications, such as news website, video website, skype, BitTorrent and GoogleEarth, to investigate how many ports and sessions they are costing on the NAT mapping table dynamically from the first NAT bindings being established to the last one being destroyed.
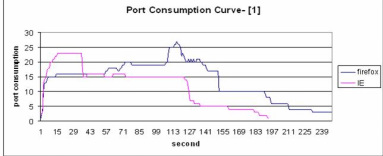
As illustrated in Figure 1, when open a news website (e.g., [1]) that often contains a number of images and flashes, it takes up to four minutes from the first NAT binding being established to the last one being destroyed. During the four minutes new NAT bindings are established while the old ones are expiring. For IE, the port consumption dramatically rose and reached the peak of 20 ports at the 18th seconds and then decreased gradually to zero at the 200th seconds. While for firefox, after opened a dozen of ports at the beginning, it then gradually increased to 25 until the 120th second, and finally dropped gradually to zero until the 240th second. It is evident that even if visit the same website, port consumption varies from web browser to web browser.
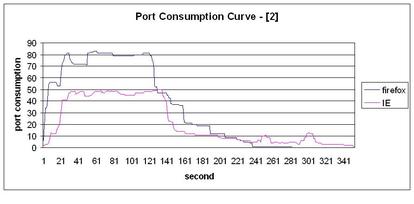
Figure 2 shows same evidence that firefox consumes more ports than IE when open a video website which cost up to 80 ports during browsing its main page.
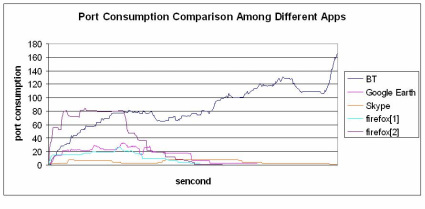
Port consumption comparison among different applications, including BitTorrent, Google Earth, skype and using firefox to visit news website and video website, is demonstrated in the Figure 3. BitTorrent has constantly occupied hundreds of ports while downloading and dominated in the port consumption. Firefox has consumed dozens of ports for about two minutes and ranked second after BitTorrent, while others merely cost less than 25 ports during a whole communication process for each.
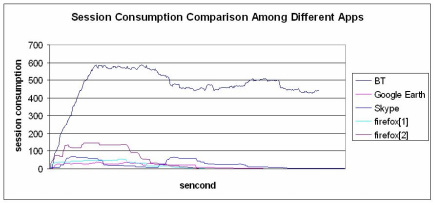
The session consumption comparison among the same set of applications is illustrated in Figure 4. Usually, apps consume a few more sessions than ports, and for the P2P apps, sessions number could be as a couple of times as ports number. For example, BitTorrent established five hundreds of sessions while the port consumption was under a hundred in the first minute of the communication, because when BitTorrent initiates a downloading it first uses the same source port to connect to the different destinations (destination IP and port) therefore one source port multiplexing different sessions. Skype is another example that uses one source port to multiplex different sessions thereby saving source port consumptions on NAT.
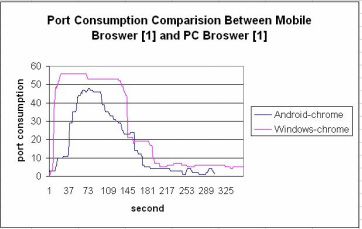
Furthermore, we have tested and compared mobile apps and PC apps. The test results shown in Figure 5 and Figure 6 indicate that even the same app, either web-browser chrome or Google Earth, the mobile release - Android chrome and Android Google Earth consumed fewer ports than the PC release – Windows chrome and Windows Google Earth respectively.
We tested popular applications, such as news website, video website, skype, BitTorrent and GoogleEarth, to investigate how many ports and sessions they are costing on the NAT mapping table dynamically from the first NAT bindings being established to the last one being destroyed.
As illustrated in Figure 1, when open a news website (e.g., [1]) that often contains a number of images and flashes, it takes up to four minutes from the first NAT binding being established to the last one being destroyed. During the four minutes new NAT bindings are established while the old ones are expiring. For IE, the port consumption dramatically rose and reached the peak of 20 ports at the 18th seconds and then decreased gradually to zero at the 200th seconds. While for firefox, after opened a dozen of ports at the beginning, it then gradually increased to 25 until the 120th second, and finally dropped gradually to zero until the 240th second. It is evident that even if visit the same website, port consumption varies from web browser to web browser.
Figure 2 shows same evidence that firefox consumes more ports than IE when open a video website which cost up to 80 ports during browsing its main page.
Port consumption comparison among different applications, including BitTorrent, Google Earth, skype and using firefox to visit news website and video website, is demonstrated in the Figure 3. BitTorrent has constantly occupied hundreds of ports while downloading and dominated in the port consumption. Firefox has consumed dozens of ports for about two minutes and ranked second after BitTorrent, while others merely cost less than 25 ports during a whole communication process for each.
The session consumption comparison among the same set of applications is illustrated in Figure 4. Usually, apps consume a few more sessions than ports, and for the P2P apps, sessions number could be as a couple of times as ports number. For example, BitTorrent established five hundreds of sessions while the port consumption was under a hundred in the first minute of the communication, because when BitTorrent initiates a downloading it first uses the same source port to connect to the different destinations (destination IP and port) therefore one source port multiplexing different sessions. Skype is another example that uses one source port to multiplex different sessions thereby saving source port consumptions on NAT.
Furthermore, we have tested and compared mobile apps and PC apps. The test results shown in Figure 5 and Figure 6 indicate that even the same app, either web-browser chrome or Google Earth, the mobile release - Android chrome and Android Google Earth consumed fewer ports than the PC release – Windows chrome and Windows Google Earth respectively.
 [1] http://www.sina.com.cn
Figure 1. Port Consumption Comparision between firefox and IE |
 [2] http://www.youku.com
Figure 2. Port Consumption Comparision between firefox and IE |
 [1] http://www.sina.com.cn
[2] http://www.youku.com Figure 3. Port Consumption Comparision Among Different Applications |
 [1] http://www.sina.com.cn
[2] http://www.youku.com Figure 4.Session Consumption Comparision Among Different applications |
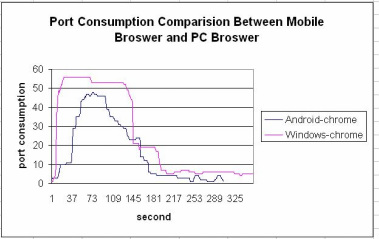 Figure 5. Port Consumption Comparision
|
 [1] http://www.sina.com.cn
Figure 6. Port Consumption Comparision |
